|
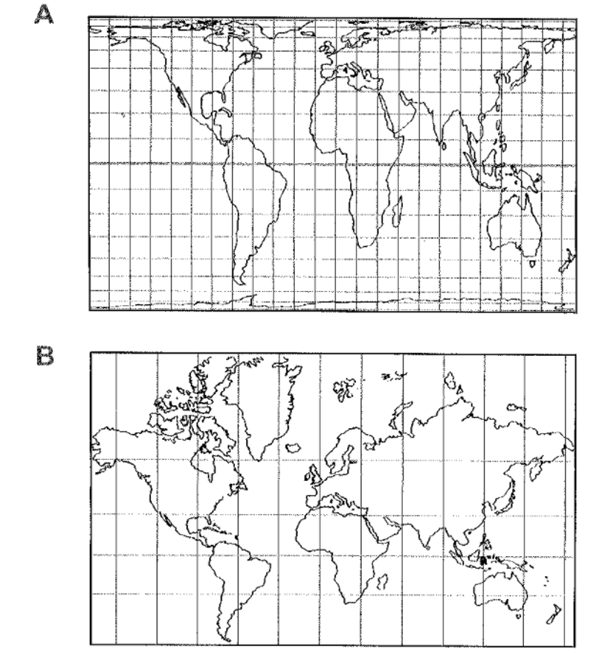
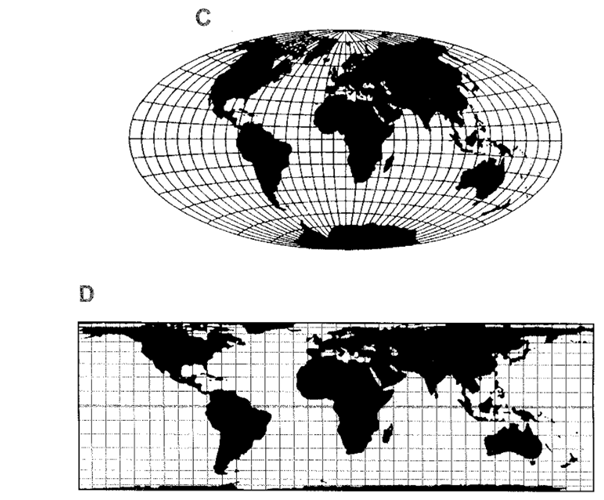
P1 新西兰某地农作物 P2 拥挤人口 P3 Map Wars 朗阁讲师点评 1. 本场根据考生们反馈阅读和听力都非常难,很多学生反映阅读来不及做完。从题型上来看P2和P3都考察了配对题,此外还出现了summary的选择以及填空题。 2. 整体分析:涉及农业类(P1)、社会类(P2)、人文科学(P3)。 3. 部分答案及参考文章: Passage 1:新西兰某地农作物 难易度:话题难度中等 题型:待回忆 Passage 2: 拥挤人口 难易度:较难 题型:配对+填空 14-20 匹配 14.iv Problems that result in crowding 15.vii Definitions of crowding and density 16.x Nature and results of Calboun's experiment 17.i Other experiments on the base of Calboun's experiment 18.vi What cause the upset feel of crowding 19.ii The effects of crowding on people 20.viii Advice for crowded work environment 21-26 填空 21.privacy 22.male prison 23.personal space 24.attraction 25.help 26.control Passage 3:Map Wars 难易度:较难 题型:匹配+选择 A map of the world expresses a point of view. A correct model of the earth is a sphere - or an ellipsoid to be precise. Photographs of the earth from space provide comforting reassurance on that point. If you wish to know the relative positions of the continents and the oceans you should go out and buy yourself a globe and spin it around. But a globe cannot be pinned to a wall or printed in a book. For that you need a two-dimensional representation. This is where the problems start since you cannot project three-dimensional information onto a flat plane without making certain assumptions. The arguments between cartographers mostly concern what those assumptions should be. The simplest two-dimensional representation is a 'cylindrical’ projection - what you get by wrapping a sheet of paper around a globe and simply transferring the information across. This means it indicates true north and south. So, Newfoundland is directly north of Venezuela and it appears that way on the map. East and west similarly are also indicated correctly. Such a map demonstrates what is called 'fidelity of axis’. One of the longest-lived cylindrical projections was based on the needs of sixteenth century navigators. Gerhard Kremer, a Flemish mathematician, produced his view of the world in 1569. ‘Kremer’ translates to 'merchant’ in English and 'mercator’ in Latin. And the Mercator projection survives to this day in many books and maps. Mercator’s projection of the world also shows intermediate compass directions like north-west more or less accurately. So, it is possible to conclude from his map that Brazil is south-west of Liberia and if you plot a course in that direction you will eventually arrive at your destination. No wonder it was appreciated by the early explorers! If it can be used in this way a map is said to have 'fidelity of angle’. But fidelity of angle is only achieved at a cost. To make it work, the further away you get from the equator, the further apart you have to move the horizontal lines of latitude. As these distances increase so do the sizes of the countries underneath them. So, by the time you get to the North or South Poles the lines would be drawn infinitely far apart and the Arctic and Antarctic regions can scarcely be represented at all since they would be infinitely large. More importantly the relative sizes of intermediate areas are completely distorted; South America seems smaller than Europe whereas in fact it is twice the size. These changes in scale distort both the size and shape of countries. Given such defects, it is surprising that the Mercator projection has survived so long, especially as dozens of other more satisfactory projections have appeared since. One of the best known of these is the Aitoff projection of 1889, which attempted to represent country sizes and shapes more correctly. But to do so required a compromise - the lines of latitude and longitude had to be 'bent’. Fidelity of axis had thus been lost and you could no longer judge north, south, east and west so easily. Most of us, however, did not notice that these projections were different from Mercator. We assumed that all maps were simply factual statements. Dr. Arno Peters, a German historian, was irritated by the maps he saw widely published, particularly by the survival of Mercator which he argued, gave a euro-centric view of the world. It shrank the developing countries since most of these are around the equator, and it expanded the richer countries since they lay further north. Even the equator itself is shown two thirds of the way down on the traditional Mercator map. Dr. Peters insisted that his map, which first appeared in 1985, has equal-area projection so that no country is given prominence over another, plus fidelity of axis to avoid the disorientating effect of bent lines of latitude and longitude. Then there is the question of country shape. If you were to take a photo of a globe in its normal position you would find the countries around the equator like Zaire or Ecuador came out of it pretty well. They would be shown relatively large and with something close to their correct shape. But further north or south there are considerable distortions: Australia tails away alarmingly. Dr. Peters decided that the minimum distortions should occur not at the equator but at the 45 degree lines of latitude, as these are much more populated areas. However, this controversial Peters map does radically change the shape of both Africa and South America; and although all projections distort to some extent, it is clear that Africa appears exceptionally long and thin on the Peters map. But the oddity of the Peters projection is at least partly responsible for its success, as there has been widespread discussion on the misrepresentation of country sizes in previous maps. The issues which the Peters map raises are relatively simple. If you decide you want an equal area map with fidelity of axis you will always get something resembling the Peters projection. If you decide that shape is more significant you will get something else. The real value of the Peters projection is that it has made the world think about something that before was never taken seriously: that maps of the world represent a point of view just as do press articles or TV programmes or photographs. But it isn’t recommended that you navigate a '747’ round the world with the Peters projection or with any other single global projection they would all lead you astray! SECTION 3: QUESTIONS 28-40 Questions 28-31 Complete the summary. Choose your answers from the box below the summary. List of Words
There are more words than you will need to fill the gaps. For four centuries, map makers have been trying to convert three-dimensional information as accurately (example) as possible onto a two-dimensional plane. However, each method of 28 _________________ involves a compromise. Thus Mercator’s projection indicates true north and south, known as fidelity of 29_________________ , but misrepresents the relative size of countries. To avoid this distortion, other cartographers rounded the lines of latitude and longitude. Dr. Peters felt that such maps presented a first-world 30 _________________. His map, with equal area projection, enables us to 31 _________________ the size of one country with another. Questions 32-36 Use the information in the text to match the map projections [M A P] with the characteristics listed below.
Example designed for the needs of early navigators M 32 __________makes Europe seem larger than it is 33 __________maximum distortions at the poles 34 __________maintains greatest accuracy at 45 degrees latitude 35 __________most distorts the position of the equator 36 __________more accurately represents country shapes and sizes Questions 37-39 Choose one drawing (A-D) to match each of the three projection types (37-39).
There are more drawings than names so you will not use all of them. 37 __________Mercator projection 38 __________Aitoff projection 39 __________Peters projection Question 40 Choose the correct letter A-D. 40The main point made by the writer of this article is that we need to ... A understand maps. B understand map-making. C understand that maps are not objective. D understand the importance of latitude and longitude. 考试建议 作为三月份的**场考试本场考试三篇文章中有两篇都较难,而且都考察到了配对题。并且整个二月份的雅思考试阅读部分也被大家吐槽难度不低,所以广大考生们还是要对阅读科目重视起来,夯实自己的词汇基础,语法基础。 |
文中图片素材来源网络,如有侵权请联系删除